Bonding and antibonding molecular orbitals (MOs) for electrons can
be approximated as a sum and a difference, respectively, of atomic
orbitals (AOs) centered on the two bonded atoms. How strongly bonding
or antibonding the MOs are, that is how much they are shifted from
the energies of the component AOs, depends on the overlap (S) and
energy difference (D) of the component
AOs.
The approach used here is not to consider the three-dimensional
electron in the double-well Coulombic potential of two nuclei but to
consider the one-dimensional problem of a proton in a double-well
harmonic potential. We have already treated this simpler problem
quantum-mechanically using Erwin meets Goldilocks. The
problems are very closely related, and show the same kind of response
to S and D.
|
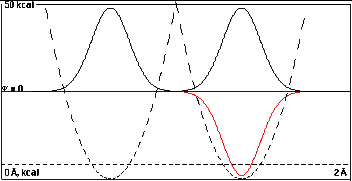
Here the two wells are far apart, 0.75Å.
Note how high the intersection of the dashed potential
energy curves is.
At this separation the wells and their wave functions are
practically independent. If the right half of the diagram
were covered it would be easy to imagine that the nodeless
wave function in the left well is the lowest energy solution
of this isolated single well.
The lowest energy solutions of this double well problem
are the black, double humped curve and the red one, which is
invisible on the left because it lies almost exactly under
the black one.
Obviously the nodeless black solution can be thought of
as the sum of isolated nodeless waves in the two individual
wells, 2-1/2(A+B), and the one-node red solution
can be thought of as their difference,
2-1/2(A-B).
The black curve is negligibly lower in energy (0.0002
kcal/mole) that the red one, and the probability density
from the squared wavefunctions are practically identical.
Overlap is too small to make a difference.
|
|
|
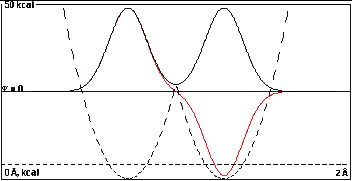
In the second plot the wells are closer, 0.55
Å, which lowers the intersection of the potential
energy parabolas, and there would be a little overlap
between the isolated-well wavefunctions.
The black and red curves can still be reasonably
approximated by
2-1/2(A+B) and 2-1/2(A-B).
The red wave is marginally more curved toward the
baseline than the black one (as it must be to give a node),
but the energy difference is only 0.034 kcal/mole,
not enough to show separate dashed total energy lines on
this plot.
|
|
|
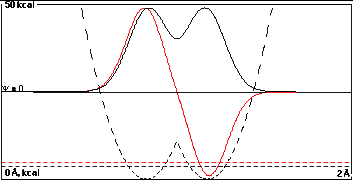
In the third plot the wells are only 0.35 Å
apart, and there is enough overlap to give a substantial
energy splitting of 1.08 kcal/mole.
Note that the true wave functions shown are not
exactly
2-1/2(A+B) and 2-1/2(A-B).
You can tell this because there is a difference between
the black and red curves at the left side of the left well
that is larger than one would expect from adding the "tail"
of the right-well function. Part of this is probably due to
reduction of the size of the black curve because of
normalization (<2-1/2), but part is
probably due to hybridization as well.
It is possible with
time-dependent quantum mechanics to predict how rapidly a
particle that started in one well would get to the other.
The time it takes is ~5 x
10-14 sec divided by the
energy difference between the black and red functions in
kcal/mole. So in the top case the time between
transformations is about 2.5 x 10⁻¹⁰ sec,
while in the case to the right it is about 5 x
10-14 sec.
|
|
|
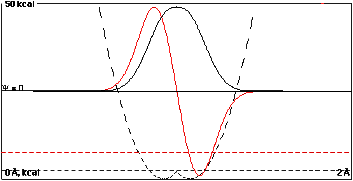
Here the wells are so close together, 0.15
Å, that they have practically coalesced. Overlap
of the isolated-well wavefunctions would be approaching 1,
and the energy separation of the resulting "sum" and
"difference" wavefunctions is 5.0 kcal/mole.
This sequence of plots shows that increasing overlap
causes a separation or "splitting" of the bonding (sum) and
antibonding (difference) energy levels. The bonding
level is lower than the component isolated-well functions,
and the antibonding level is higher.
Note that in all cases the time-independent probability
density has right-to-left symmetry.
|
|
|
II. Overlap Fights an Intrinsic Energy
Difference (D
= 0.5 kcal/mole)
The following four plots correspond exactly to the first
four, except that now the two wells have slightly different
minimum energies. The well on the right has been shifted up
by only 0.5 kcal/mole, which is barely visible on the 50
kcal scale. In order to mix wave functions from the right
well with those from the left one must "pay the energy cost"
of the higher potential on the right.
|
|
Where the degenerate orbitals in Part I were always
symmetrical, 50% in each well, here there is a cost of some
fraction of 0.5 kcal/mole to mix the wavefunction from the
second well into that of the first.
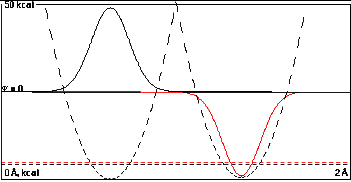
So in the absence of appreciable overlap at a distance of
0.75 Å, there is essentially no mixing. The
low-energy black function is almost entirely localized in
the left well, and the high-energy red function almost
completely in the right well.
The difference in energies is 0.500000 kcal/mole, exactly
the difference of the two isolated well depths. The shift
in energy on allowing the two orbitals to interact
forming a sum and difference was less than 0.0000003
kcal/mole.
|
|
|
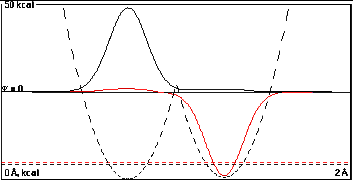
At a distance of 0.55 Å, there is a little
more overlap, and it tries valiantly to mix the two
localized functions, but it doesn't succeed much against the
energy cost of mixing the functions of different energy.
The splitting of the sum and difference functions is now
0.50090 kcal/mole, a puny 0.00090 kcal/mole increase
from the difference of the component localized
functions.
|
|
|
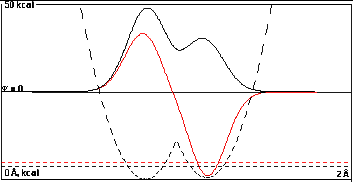
At 0.35 Å the overlap is getting large
enough to show clearly the lesser amount of the high-energy
right component in the sum function and the lesser amount of
the low-energy left component in the difference
function.
The energies of the sum and difference functions are
beginning to diverge significantly to 1.18196 kcal/mole, a
0.682 kcal/mole increase over the initial 0.5
kcal/mole difference.
This is still substantially less than the 1.08 kcal/mole
relative shift for the same overlap when the initial energy
difference was zero in Part I.The final difference in energy
levels is larger here than in Part I, but only because the
isolated functions had a head start of 0.5 kcal/mole.
|
|
|
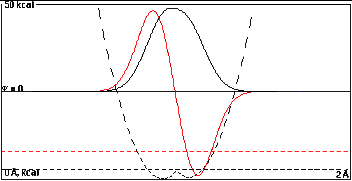
The large overlap at 0.15 Å now dominates
and the energy separation of 5.0 kcal/mole, is practically
the same as in Part I. Still only 4.5 kcal/mole of
this is from the mixing, the other 0.5 kcal/mole comes from
the head start.
The shape of the wave functions show only slight
dissymmetry with the low-energy sum function biased toward
the left and the high-energy difference function biased
toward the right.
|
|