Potential Energy Surfaces for Structure
and Dynamics
(There are three problems)
|
Fully specifying the location of a diatomic molecule, AB,
would require specifying six numbers, the x, y, and z
coordinates of each of its atoms.
This would be hard to graph on two dimensional paper.
But if one is not interested in motion of the molecule as
a whole, nor in its rotation, it is easy to draw on paper an
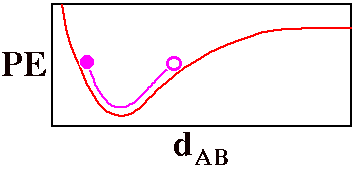
explicit graph to show the potential energy (PE) of
the molecule as a function of the distance between the two
atoms dAB. The red line on this graph is a
crude version of such a potential energy curve (the Morse
potential) for a bond that can break.
The violet circle could be thought of as a
ball poised to roll back
and forth between the two stationary positions in which all
of its energy is potential energy. When the ball reaches the
bottom of the violet curve, the potential energy has been
converted into kinetic energy. Motion of the ball can be
used to visualize the vibration of the diatomic molecule as
the bond stretches and shrinks interconverting potential and
kinetic energy.
|
|
|
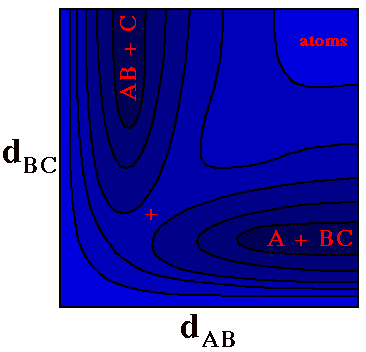
One can include a third dimension and go from a Potential
Energy line to a Potential Energy Surface (PES), by using
contours and/or colors to code the Potential Energy as a
function of two geometric variables.
For example, the plot to the right shows the Potential
Energy for a LINEAR triatomic molecule A-B-C,
with darker colors corresponding to lower energies.
(Allowing the molecule to bend at B would require a third
geometric dimension and make plotting difficult.)
One could imagine this plot as a topographic map with
altitude corresponding to potential energy. There are two
valleys meeting at a pass (denoted by the
+) with steep
cliffs along the bottom and left edges and a
plateau at the top right.
When both dAB and
dBCare long (top right) one has three
separate atoms at an energy that ceases to depend on
further increase in these distances.
At the lower right is a dark valley corresponding to a
BC molecule with the A atom far away (BC is
short and AB is long).
At the upper left is the corresponding valley for an
AB molecule with the C atom far away.
|
|
|
Molecular Vibration
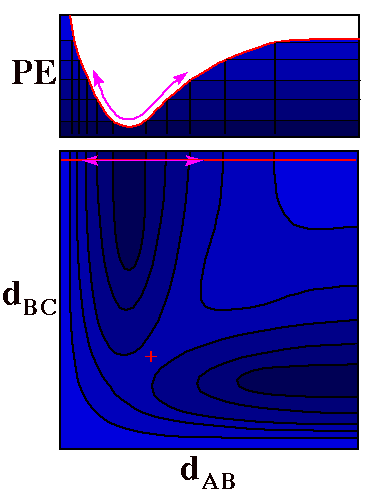
Slicing this three dimensional PES along the horizontal
red line and folding the top
section up and back gives a profile (at the top) that is
exactly the two-dimensional plot of potential energy for
stretching of the AB molecule that was shown at the top of
this page.
The double-headed violet
arrow shows the path of the ball rolling back and forth to
display vibration of AB.
The only difference between this motion and the one in
the first two-dimensional plot is that now it is understood
that C is at a given substantial distance from B.
In fact one can use motion of a single ball on the
potential energy surface to show motion of two
atoms (changes of both dAB and
dBC), as shown in the next figure
|
|
A Reactive Collision
Substitution at B
A + BC -> AB + C
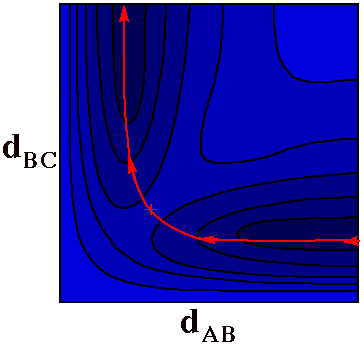
At first motion of a ball along the red line in this
figure corresponds to A approaching BC (i.e.
dAB shrinks from a great distance while
dBC stays at the bonding distance for the BC
molecule). As A gets close to BC, the BC bond begins to
stretch until at the pass
(+), dAB =
dBC. From this point on the C atom flies away as
A finishes bonding to B.
The red path is thus a trajectory for the reaction
A + BC -> AB + C.
Note how different this trajectory plot is from the
trajectory plot of Heller.
Heller's plot used a separate point for each atom. In this
plot a single point denotes the position of all
atoms.
|
|
|
Slicing out a thin section of the PES along the curved
trajectory of the previous figure and flattening it to look
at the potential energy profile would yield the "Reaction
Coordinate Profile" below. This plot shows the minimum
amount of energy that would be required to get from one
valley to the other across the pass marked by
+.
|
|
Obviously there would be many other paths that would pass
through the same +
point, but this one seems as good as any for a start. One
way to define such a path unambiguously is to descend into
both valleys from the
+ pass making a
90° angle with every contour as it is crossed. This
"Steepest Descent" path is well defined, but it may not be
dynamically realistic (see below).
|

|
|
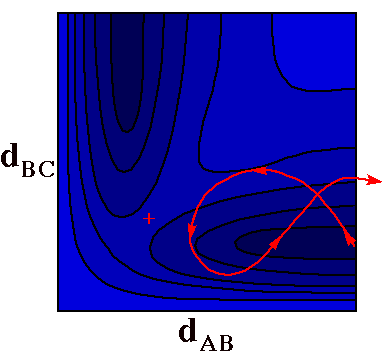
A Nonreactive
Collision
In this trajectory the ball has more than enough energy
to gain the altitude of the pass and react, but reaction
fails because the ball caroms off the walls at the head of
the valley and heads back out to the right. In this case too
much of the energy was in vibration of the BC molecule
(initial vertical motion) and too little in translation of
the A atom toward the BC molecule (initial horizontal
motion).
Problems:
1) Think about how the velocity of the
ball changes as it follows this trajectory, remember that
the sum of potential and kinetic energy should be
constant. (Note - the curve was sketched
by hand and may not be correct in detail).
2) Consider how a change in the phase of the
vibration of BC (whether it is stretching or shrinking at
the time that A collides with it) could influence the
probability of reaction.
3) Sketch two cross section of the PES passing
through the red +. One
section should run diagonally from lower left to upper
right; the other from upper left to lower right.
|
|
|
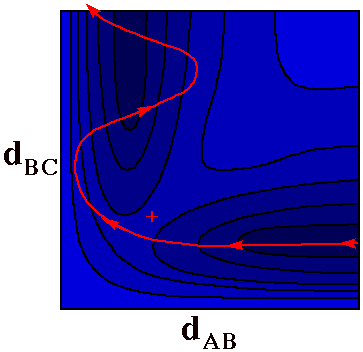
Vibrationally Excited
Product
It would be very difficult, maybe impossible, to roll a
ball along the Reaction Coordinate trajectory on the PES.
Here is a more likely trajectory where the ball ends up
snaking back and forth as it rolls down the AB + C valley.
Some of the energy that was originally in the motion of A
toward BC ends up in vibration of the AB product molecule.
Even a marble that rolls directly across the
+ point is unlikely
to follow the Reaction Coordinate.
|
|
|
Realism
Just how fanciful is this way of looking at reaction
trajectories as the rolling of a ball over a PES?
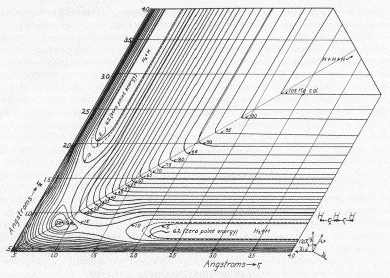
In 1935 Henry Eyring at Princeton showed that if one
"distorted" the surface by making the dAB and
dBC axes form an angle of 60° instead of the
customary 90°, the motion of a rolling ball would
precisely track the behavior of the two-dimensional linear
triatomic system.
Here is the surface he drew for H3 to
illustrate this approach.
Of course there were still important weaknesses:
A profound weakness was assuming that a
trajectory could be strictly deterministic rather than
probabilistic and quantized as quantum mechanics demands.
For example the "ball" could never roll straight along a
valley floor, because a true, quantum mechanical molecule
has a finite minimum amount of vibration - it would
always have a snake-like path.
A less profound weakness was that Eyring used a
relatively simple function to reckon the altitude of the
PES rather than using accurate quantum-mechanical values
of the energy for the various nuclear positions. This
function resulted in a shallow well at the pass between
the two valleys, which came to be known derisively as
Lake Eyring. The lake disappears to become
a saddle or "potato chip" point (like the
+ above) on a more
realistic PES.
|
(Click for more
detail)
|
People now calculate more sophisticated Potential Energy Surfaces
(though still not good enough to treat vibrations really accurately)
and take quantum mechanics into better account, but this is not our
business. Our purpose was to see how knowing the potential energy as
a function of structure would allow us to get a foothold on
understanding molecular dynamics and reactivity.
For a real triatomic system there is an additional geometric
variable (bending) that makes drawing an easily visualized PES
impossible. But in our mind's eye (or the computer's) we can dream
about the motion of a single marble over a 39-dimensional surface
showing the coordinated motion of 13 atoms as they vibrate and
exchange bonding partners.
We can think about valleys corresponding to stable molecules, and
cliffs where atoms run into one another, and mountain passes through
which the "ball" must squeeze to get from one valley to another.
We can see one reason why a system with more energy
reacts more easily - because it can get to higher altitudes, where
the pass is wider and the chance of hitting it during a trajectory
is greater (the pass typically widens faster than the valleys with
increasing energy). A more significant reason for a reaction to
accelerate with increasing temperature is that the Boltzmann
distribution gives a much higher probability of the system's
having an energy in excess of the minimum necessary to reach the
+ point.
We need a more convenient name for the
+ point. Eyring referredto
it as the "transition state", though others have pointed
out that it is not really a "state" with a finite lifetime, since
there are two directions of motion along which it is unstable.
They call it a "transition structure".
As in the Heller case, individual trajectories provide
too much detail, and one would need to
consider an "Avogadrian" number of trajectories with various initial
conditions to model a bulk reaction. With high-speed computers people
do this kind of thing with a significant measure of success (for
example one experimental challenge nowadays it to predict how
proteins fold into their active conformations).
But we want a simple scheme for predicting reactivity, so we
will lump things together statistically using the ideas of enthalpy
and entropy. We will use the PES to gain insight into these
quantities.
copyright 2001
J.M.McBride


