(There is a problem at the end)
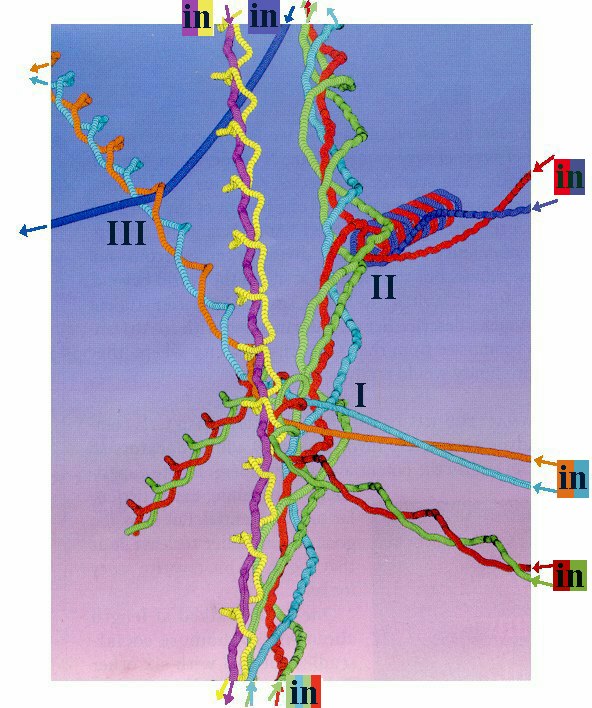
The picture below visualizes three collisions involving an atom coming from the top, four diatomic molecules from from the top and the right, and a tetraatomic molecule coming from the bottom. Professor Eric J. Heller, a theoretical chemical physicist at Harvard, prepared it (without my clumsy arrows and labels) as an art object, but one can spend a lot of time trying to appreciate all the information it presents about the behavior of these species.
Calculated paths of the 13 atoms are presented in a multiple-exposure "stroboscopic" image with arrows showing where each atom enters and exits the field of view. Barely visible at this resolution is that each atomic "string" is made up of a row of overlapping balls showing the atom's position at equally spaced instants in time. The balls in the single-stranded blue rope entering at the top center and exiting center left are very close together, indicating relatively slow motion of this single atom.
The orange and light blue strings entering from the right represent a diatomic molecule that is rotating slowly as it proceeds toward the site of Collision I with two other diatomic molecules (red/green from the right and yellow/violet from the top) and the tetraatomic molecule (red/green/green/light blue from the bottom). After Collision I the orange/light blue diatomic molecule is translating and rotating more rapidly (balls further apart along each rope) as it sails toward the upper left corner, to collide with the blue atom in Collision III.
Note how the vertical yellow strand winds in a drunken helix around the violet strand. This indicates that the yellow atom is much lighter than the violet one in this diatomic molecule, so that rotation and vibration of the molecule involves much more motion of the yellow atom than of the violet one.
Note how the diatomic molecule denoted by red and blue strands entering from the upper right starts with high translational velocity toward the left (balls far apart), but that Collision II with the tetraatomic molecule converts this energy into rapid rotation as the molecule bounces rather slowly toward the rear of the picture, generating a tightly packed red-blue double helix. The recoiling diatomic molecule must be vibrating six times as fast as it is rotating to generate the hexagonal cross section of this double helix.
For our purposes we need not be concerned with all the approximations involved in calculating this imaginative trajectory. (Heller used molecular mechanics, not quantum mechanics, but since no bonds were made or broken, this may not be too bad.). Our idea is just to show that it is possible to envision a very detailed course for how atoms and molecules encounter one another, and to think about molecular interactions by analyzing these trajectories.
Note that in a sense this is a 13 x 3 + 1 = 40 dimensional plot, since it shows the x,y,z coordinates of 13 atoms as a function of time.
For everyday use this type of plot presents way too much information about way too specialized a situation. We cannot generally afford the time and effort to view reactions in this kind of detail. This complex picture is just one possibility for a trajectory with particular initial positions and velocities for the 13 atoms (in this simple case all molecules began with a zero velocity component perpendicular to the plane of the picture). To "understand" the behavior of bulk chemicals in this way we would have to consider "Avogadrian" numbers of different trajectories, which would far exceed our powers of explicit visualization.
So instead of using explicit trajectories, we generally lump things together statistically and speak of the enthalpies and entropies of starting materials, products, and "transition states". Organic chemists typically use the quasi-equilibrium ideas of transition state theory to understand reaction rates.
An alternative type of trajectory plot for
presenting the same detailed information involves following a single
point (or "ball") as it rolls across a 40-dimensional "potential
energy surface"(PES). Visualizing such a space explicitly
is impossible, but thinking about a simpler PES will help develop our
intuition for understanding chemical kinetics and equilibrium.
Sketch trajectories for two atoms of an H2 molecule that is moving from left to right for the following situations:
a) Molecule in vertical orientation, vibrating but not rotating.b) Molecule starts in vertical orientation, not vibrating but rotating about an axis perpendicular to the page.
c) Molecule starts in vertical orientation, not vibrating but rotating about an axis that is horizontal and in the page.
d) Same as b, but with the molecule vibrating as well.
e) Same as c, but for HF rather than H2.
Spend more time thinking than in refining the art work. Maybe draw just a few sets of balls connected by lines that trace the atomic paths.
|
|
|